Dow Jones Index
• The last five trading days have had a average daily points range between the intra-day highs and lows of ~578 with a minimum range of 507 points on the 5th of August and a maximum of 662 points on the 9th of August. Ranking the difference between the intra-day highs and lows since the inception of the index, each of the last 5 trading days is ranked in the top 100 of the Dows intra-day price spread.
The last time we saw 5 consecutive days of top 100 daily price range volatility in the Dow was in October of 2008 which led us up to the 10th of October which saw the index see a diff of 1215 points between the highs and lows of the day (largest ever for the Dow). The streak lasted for 18 total days in October of 2008.
• Similarly in the last 3 trading days, the Dow has seen an average difference of 520 points between the opening and closing prices of the day. All three are in top 50 of the Dow’s daily opening-closing price range.
The last time we saw such wide intra-day consecutive prices moves was in September of 2008 only to be replicated in November of 2008 as well.
• 3 out of the last 5 trading days has seen top 50 price slides from a intra-day opening to closing.
The last time we saw the exact pattern (3 out of 5 days of top 50 prices slides) was in September 2008
• Moving on to daily price volatility, the last 2 consecutive trading days has seen 10-day moving annualized volatility of 50% or more.
18th September 2008 started a similar trend which continued for 61 continuous trading days and was replicated again in March/April of 2009.
The S&P 500 index showed almost the exact same statistics.
Another strong evidence of technical’s indicating a cyclical bear market with stronger headwinds ahead.
Wednesday, August 10, 2011
Gold is not a bubble
technicals suggest a surge to 2466 for gold.
It is not a bubble as viewed by any, just a changing paradigm of unprecedented world events. If you find GLD, SGOL too expensive. still time to look at IAU and gold miners as well, GDX and GDXJ.
Buy it during a pullback that the metal might see during a relief rally.
It is not a bubble as viewed by any, just a changing paradigm of unprecedented world events. If you find GLD, SGOL too expensive. still time to look at IAU and gold miners as well, GDX and GDXJ.
Buy it during a pullback that the metal might see during a relief rally.
S&P 500's Next Stop - 1250
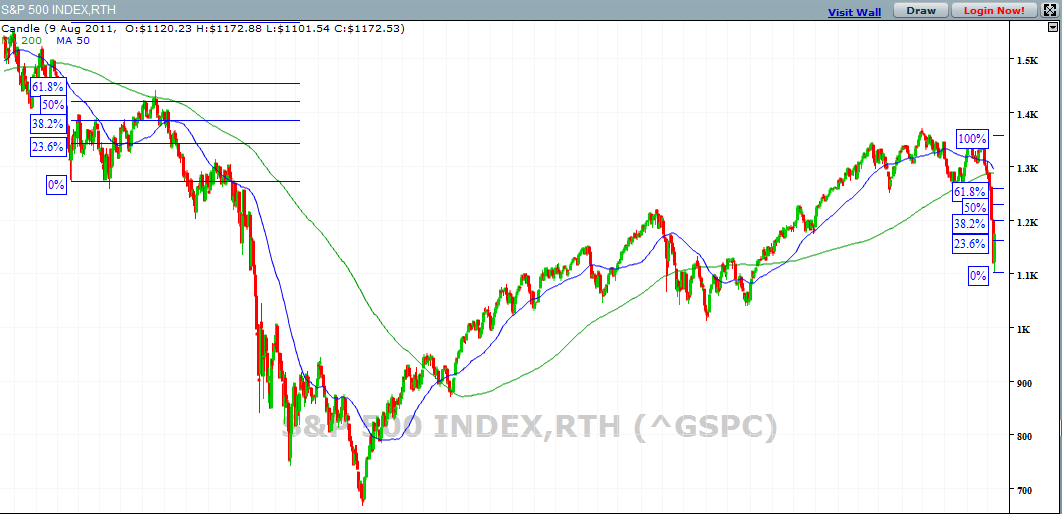
After closing at 1273 on the 9th of August, a 38.2% Fibonacci retracemnet level, I feel that the next retracement resistance for the index would be at the 50% level at 1250.
Lets wait and watch!! Seems like 2008 all over again...
Thursday, May 19, 2011
Equity Style based Diversification?
A slap in the face for fund managers who talk about equity style based diversification.
Below is a chart illustrating the correlations between the style-box components from May 2010- May 2011

Below is a chart illustrating the correlations between the style-box components from May 2010- May 2011

Wednesday, April 27, 2011
Subscribe to:
Posts (Atom)